Abstract
Purpose: In this study, the monthly population distribution was calculated for statistical verification of 10 tests (CA19-9, CA15-3, testosterone, PTH, calcitonin, AFP, CEA, CA72-4, PSA, estradiol) with changed reagents, and the trend of change By comparing and analyzing the results, we want to verify the accuracy of the results and improve the reliability of the test. Materials and Methods: From June 2021 to February 2023, for the 10 items in which the reagent was changed, the monthly percentage and standard deviation index before and after the reagent change were compared, respectively. At this time, the reference value was arbitrarily set for the comparison group in consideration of the reference value of the test item, and the groups were subdivided and compared, and the standard deviation index allowed range was -2.0 or more and 2.0 or less. Results: For CA19-9, CA15-3, AFP, CEA, and calcitonin 5 test items, the change in monthly ratio in all test sections before and after the reagent change was kept constant. On the other hand, for CA72-4, PSA, testosterone, PTH, and estradiol items, the standard deviation index exceeded the acceptable standard after changing the reagent. CA72-4 test items showed an increasing trend in standard deviation index in the test section exceeding the reference value. In the case of the PSA test item, the maintenance ratio of 0.04 ng/mL was significantly decreased after changing the reagent. The testosterone test item had a standard deviation index of -2.5 in the test section exceeding 10.1 ng/mL after changing the reagent, and the standard deviation index of the PTH test item was out of the acceptable range in all test sections. It was confirmed that the estradiol test item showed an overall increase in the result value. Conclusion: Through this study, the continuity and accuracy of the test results could be verified. It is considered that the stability of the test can be secured by analyzing the factors affecting the test result and solving the cause for the test item whose standard deviation index is out of the acceptable standard.
Figures & Tables
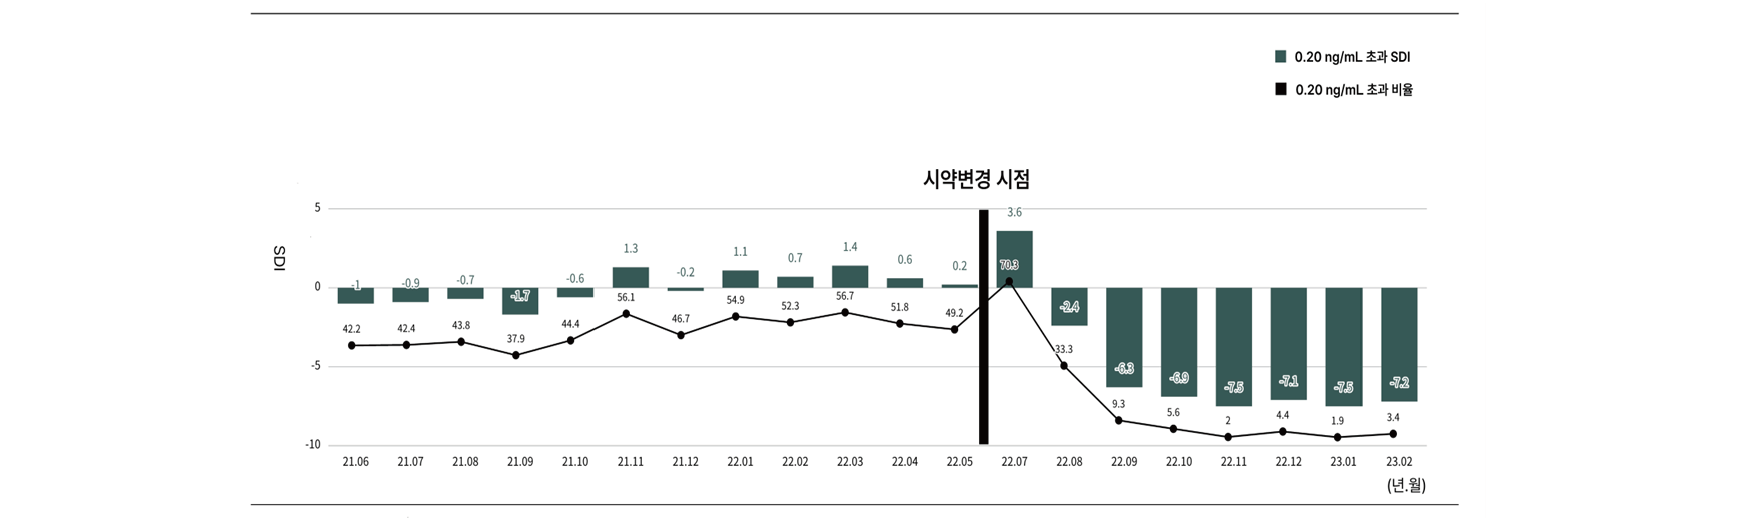
Fig. 1. Based on the previously reported value (0.20 ng/mL) for PSA test items, the percentage and SDI trends for the number of cases exceeding the standard value were shown.