Evaluation of Image for Phantom according to Normalization, Well Counter Correction in PET-CT

Original article
이 충운  Choong-Woon Lee*유 연욱  Yeon-Wook You문 종운  Jong-Woon Mun김 윤철  Yun-Cheol Kim

Abstract

Purpose: PET-CT imaging require an appropriate quality assurance system to achieve high efficiency and reliability. Quality control is essential for improving the quality of care and patient safety. Currently, there are performance evaluation methods of UN2-1994 and UN2-2001 proposed by NEMA and IEC for PET-CT image evaluation. In this study, we compare phantom images with the same experiments before and after PET-CT 3D normalization and well counter correction and evaluate the usefulness of quality control. Materials and methods: Discovery 690 (General Electric Healthcare, USA) PET-CT equiptment was used to perform 3D normalization and well counter correction as recommended by GE Healthcare. Based on the recovery coefficients for the six spheres of the NEMA IEC Body Phantom recommended by the EARL. 20kBq/㎖ of 18F was injected into the sphere of the phantom and 2 kBq/㎖ of 18F was injected into the body of phantom. PET-CT scan was performed with a radioacitivity ratio of 10:1. Images were reconstructed by appliying TOF+PSF+TOF, OSEM+PSF, OSEM and Gaussian filter 4.0, 4.5, 5.0, 5.5, 6.0, 6,5 ㎜ with matrix size 128×128, slice thickness 3.75 ㎜, iteration 2, subset 16 conditions. The PET image was attenuation corrected using the CT images and analyzed using software program AW 4.7 (General Electric Healthcare, USA). The ROI was set to fit 6 spheres in the CT image, RC (Recovery Coefficient) was measured after fusion of PET and CT. Statistical analysis was performed wilcoxon signed rank test using R. Results: Overall, after the quality control items were performed, the recovery coefficient of the phantom image increased and measured. Recovery coefficient according to the image reconstruction increased in the order TOF+PSF, TOF, OSEM+PSF, before and after quality control, RCmax increased by OSEM 0.13, OSEM+PSF 0.16, TOF 0.16, TOF+PSF 0.15 and RCmean increased by OSEM 0.09, OSEM+PSF 0.09, TOF 0.106, TOF+PSF 0.10. Both groups showed a statistically significant difference in wilcoxon signed rank test results (P value<0.001). Conclusion: PET-CT system require quality assurance to achieve high efficiency and reliability. Standardized intervals and procedures should be followed for quality control. We hope that this study will be a good opportunity to think about the importance of quality control in PET-CT

Keyword


서론

각종 질병치료의 가장 중요한 첫 단계는 신속하고 정확한 진단에 있을 것이다. 특히 암 환자의 경우 18F Fluoro-deoxyglucose (FDG)를 이용한 PET-CT (Positron Emission Tomography-Computed Tomography)검사는 양성과 악성종양의 감별, 병기설정, 종양의 치료 효과 판정 및 종양의 재발진단 등에 널리 이용되고 있는 검사법이다[1]. PET-CT 영상에서 정량적 평가의 지표로 사용되어지는 표준섭취 계수(Standard Uptake Value, SUV)는 방사능의 농도를 나타내는데 주입한 추적자가 체내에 고루 분포했을 때의 농도로 나누어 그 상대적 섭취율을 정량적으로 평가할 수 있으며, 방사능의 농도는 MBq/㎖ 또는 μCi/㎖로 나타낸다[2]. PET-CT 영상 검사의 수행에 있어서 고도의 효율성과 신뢰성을 얻기 위해서는 적절한 품질 보장 체계를 필요로 한다. 정도관리는 품질관리를 보증하는 하나의 방편이며 진료의 질을 향상 시키고 환자의 안전을 도모하는데 필수적인 것이다[3]. 현재 관련 학회나 제조사 차원에서 여러 주기에 따른 정도관리가 권고되고 있으며[4, 5]. PET-CT에 대한 기본평가로 수행되어 지고 있는 것은 미국전기공업협회(National Electrical Manufacturers Association, NEMA) 및 국제전기기술위원회(International Electrotechnical Commission, IEC)에서 제안한 UN2-1994와 UN2-2001의 성능평가 방법이 있다[6, 7]. 기능 영상을 제공하는 PET-CT 장비를 효율적으로 사용하기 위해서는 표준화된 성능평가 방법과 정확한 생체현상 측정 및 질병 진단을 위한 일상적인 정도관리를 충실히 수행해야 한다[8]. 본 연구의 목적은 PET-CT 3D Normalization & Well counter correction을 수행하기 전후 동일한 NEMA IEC body phantom 실험을 통하여 PET-CT 팬텀영상을 비교하고 정도관리의 유용성에 대하여 평가하고자 한다.

대상 및 방법

1. 장비

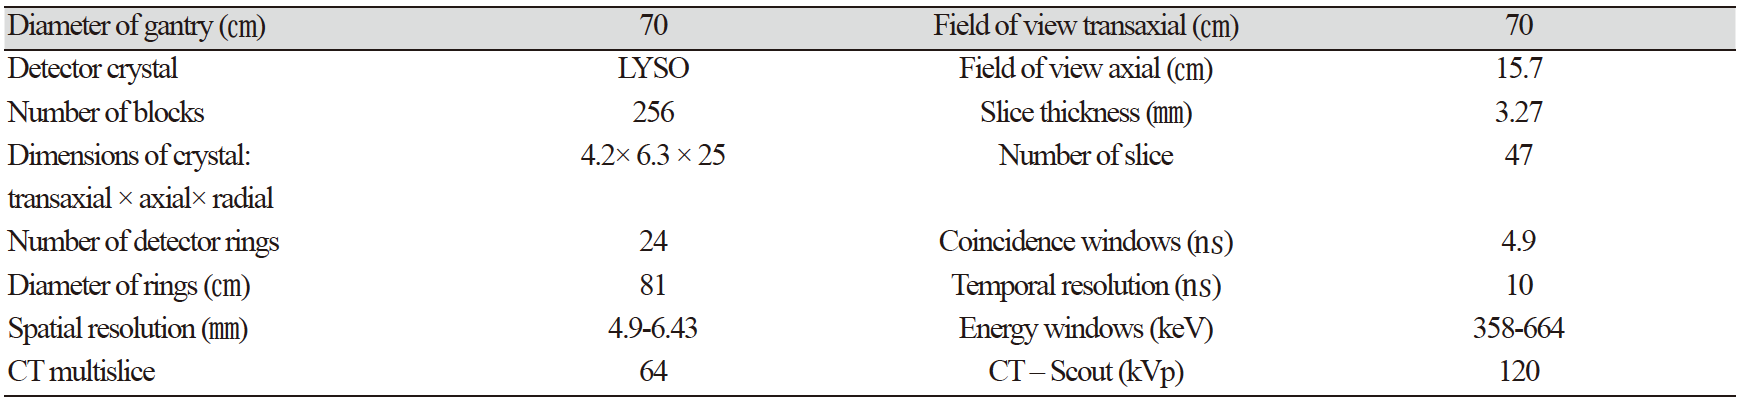
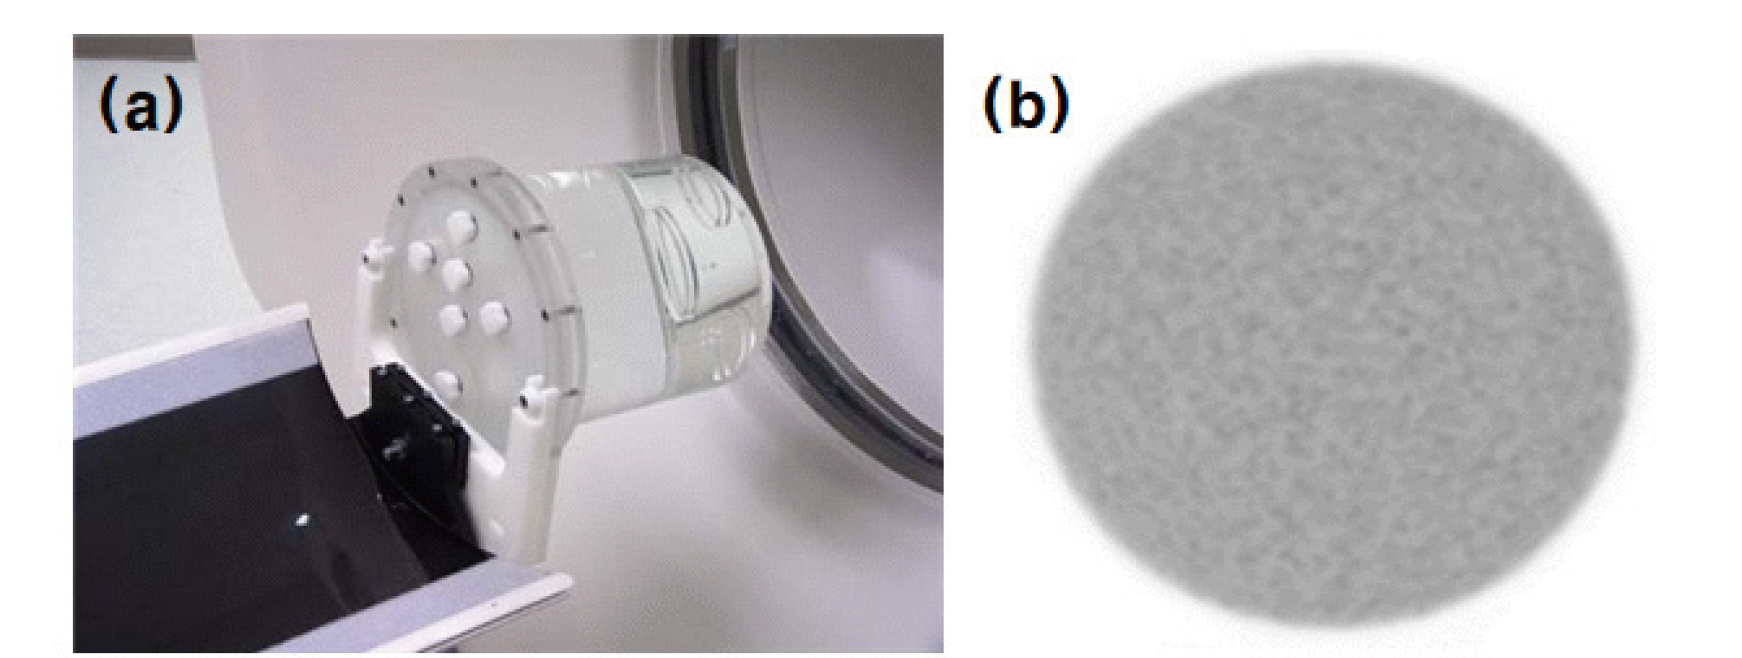
본원에서 사용하고 있는 Discovery 690 (General Electric Healthcare, USA) PET-CT 장비를 이용하였으며, 장비의 특징은 아래와 같다(Table 1, Fig. 1)[9].

http://dam.zipot.com:8080/sites/KJNMT/images/KJNMT-23-004_image/Figure_kjnmt_27_01_04_F1.png

Fig. 1. Discovery 690 PET-CT scanner was used in this study.

Table 1. Characteristic of the PET-CT

http://dam.zipot.com:8080/sites/KJNMT/images/KJNMT-23-004_image/Table_kjnmt_27_01_04_T1.png

2. 3D Normalization & Well counter correction

GE Healthcare에서 권고하는 flood phantom (18F, 20 MBq), phantom holder assembly을 사용하여 3D Normalization, Well counter correction을 수행하였다. 3D Normalization은 10,000에서 20,000개의 개별 검출기에 서로 다른 교차 평면, 서로 다른 입사각에 따라 이동하는 광자에 의해 적용되는 생성인자를 얻기 위해 개별 결정 효율의 차이를 측정하여 정규화하는 과정이며, Well counter correction은 물로 채워진 팬텀 및 이미 알고 있는 양의 방사능 동위원소를 사용하여 각 영상 픽셀의 측정된 수치와 물리적 단위(Bq/㎖)로 측정된 특정 활성값 사이의 상관관계를 측정하는 과정이다. SUV를 계산하기 위해서는 물리적 단위의 영상이 필요하고 계산된 방사능 물질 농도를 디스플레이 영상 픽셀 수치와 일치시키고 측정하려는 동위원소로 설정했는지 확인하는 과정을 분기마다 수행한다(Fig. 2, 3)[10].

http://dam.zipot.com:8080/sites/KJNMT/images/KJNMT-23-004_image/Figure_kjnmt_27_01_04_F2.png

Fig. 2. Flood phantom and phantom holder assembly (a) were used for both 3D normalization and well counter correction and figure on the right is a transverse PET image (b).

http://dam.zipot.com:8080/sites/KJNMT/images/KJNMT-23-004_image/Figure_kjnmt_27_01_04_F3.png

Fig. 3. Korea society of nuclear medicine (KSNM) recommend period of quality control through the guidelines for PET and PET-CT quality control items and measurement methods.

3. 회복계수

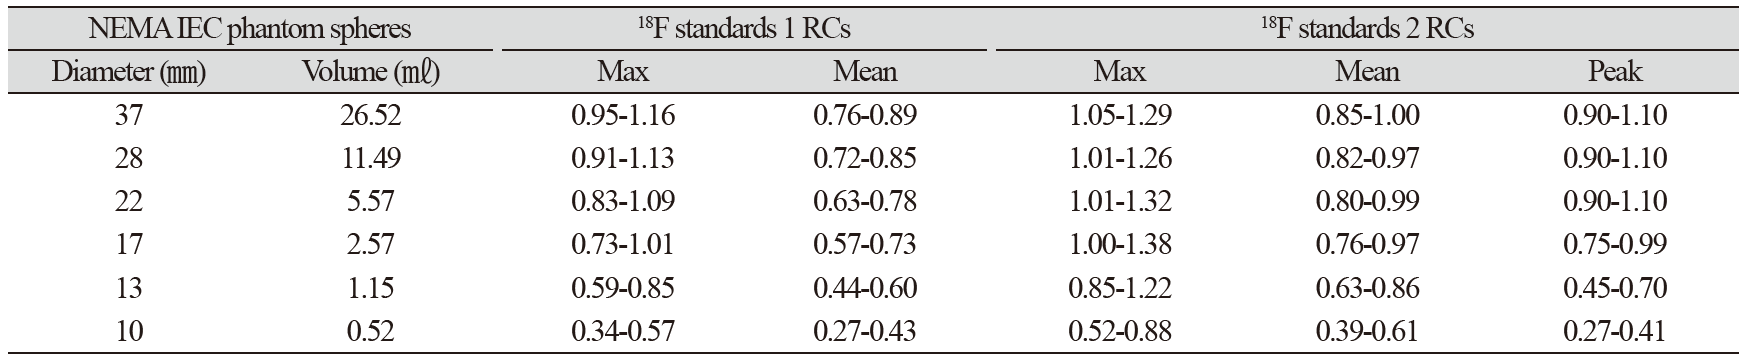
회복계수(Recovery Coefficients, RC)는 부분체적효과(Partial Volume Effect)와 같은 요인에 의해 영향을 받는 방사성의약품 흡수 값을 보정하기 위한 것이다(Eq. 1). 실제 방사능의 농도에 대한 측정된 방사능의 농도로서 아래와 같이 유도되었으며 회복계수는 NEMA 2002 및 IEC 1998 표준에서 제안한 대로 추정되었다[11, 12]. 또한 EARL의 18F PET-CT 인증사양의 표준인 standards 1은 2011년 연구에서 개발이 되었으며 그 이후로도 TOF (Time of Flight), PSF (Point Spread Function), 다양한 기능 등의 성능이 크게 향상 되었고 다중 센터의 표준은 성능이 낮은 시스템을 기반으로 해서는 안 되어 2019년에 standards 1을 업데이트한 standards 2 사양을 개발하였다(Table 2) [13].

RC = dfrac{ACL - ACBG}{ACc - ACcBG} (Eq. 1)

RC - Recovery concentration for a ROI

ACL - Radiopharmaceutical activity concentration measured in the ROI (Bq/㎖)

ACBG - Radiopharmaceutical activity concentration measured in the ROI of BG (Bq/㎖)

ACc - Radiopharmaceutical activity concentration inserted in the ROI (Bq/㎖)

ACcBG – Radiopharmaceutical activity concentration inserted in the ROI of BG (Bq/㎖)

Table 2. SUV recovery coefficients for 18F standards 1 and 2 effective as quarter 3 of 2020

http://dam.zipot.com:8080/sites/KJNMT/images/KJNMT-23-004_image/Table_kjnmt_27_01_04_T2.png

4. NEMA IEC Phantom

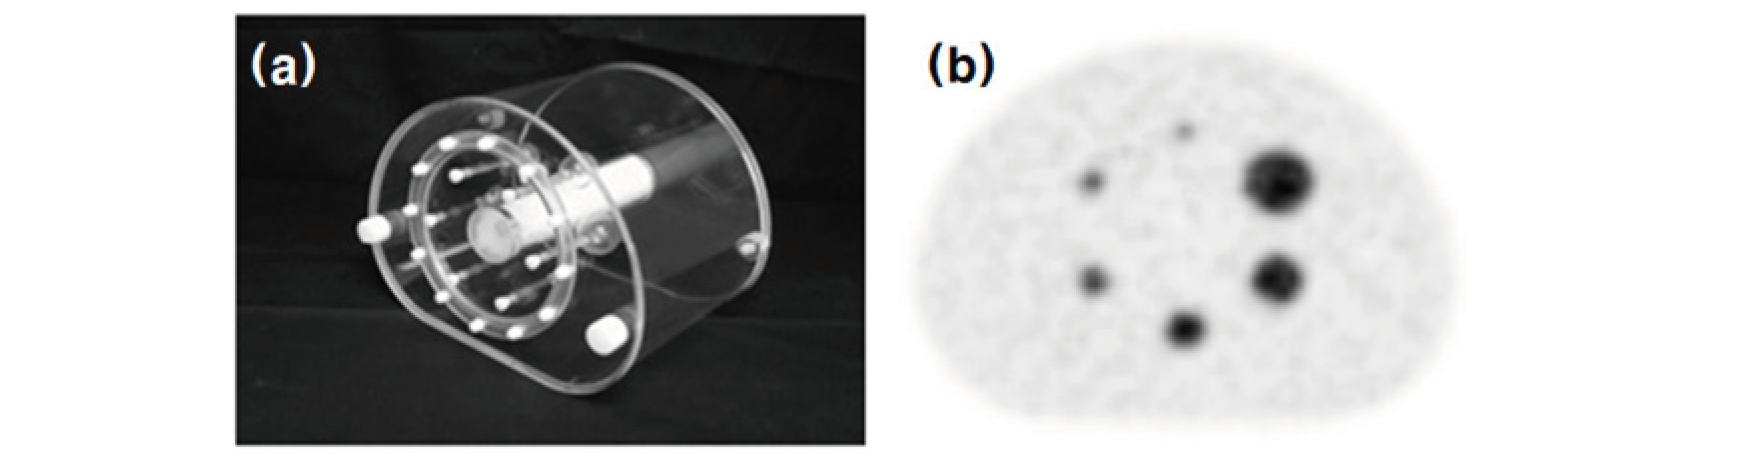
European Association of Nuclear Medicine Research Ltd (EARL)에서 권고하는 방사능 농도 기준으로 설정하기 위해 NEMA IEC phantom (Diameter 194 ㎜, volume 9700 ㎤)의 Sphere 6개에 18F를 20 kBq/㎖, 배후방사능에 2 kBq을 주입하여 최대 방사능 농도의 회복계수를 기준으로 배후방사능의 비율이 10:1이 되도록 18F를 희석하여 phantom에 주입하였다(Fig. 4)[14].

http://dam.zipot.com:8080/sites/KJNMT/images/KJNMT-23-004_image/Figure_kjnmt_27_01_04_F4.png

Fig. 4. We used NEMA IEC Phantom (a) recommended by EANM and figure on the right is a transverse PET image (b) of a NEMA phantom injected with 20 kBq/㎖ of 18F in 6 spheres and 2 kBq of 18F in the background cavity.

5. 영상 획득

GE Discovery 690 PET-CT 기기를 이용하였으며, phantom을 FOV (Field of View)에 중앙에 위치시킨 후 CT 영상은 관전압 140 kV, 관전류 auto ㎃ min 40 max 120, 0.5 sec/rotaion, pitch factor 0.984를 이용하여 영상을 획득하였고, PET 영상은 matrix size 128 × 128, slice thickness 3.75 ㎜, interval 3.27 ㎜, diameter 50 ㎝, iteration 2, subset 16, bed 당 100 sec로 2 bed PET 영상을 획득하였다. Phantom 영상 재구성 후 CT 영상을 이용하여 PET 영상을 감쇠보정 하였다.

6. 결과분석

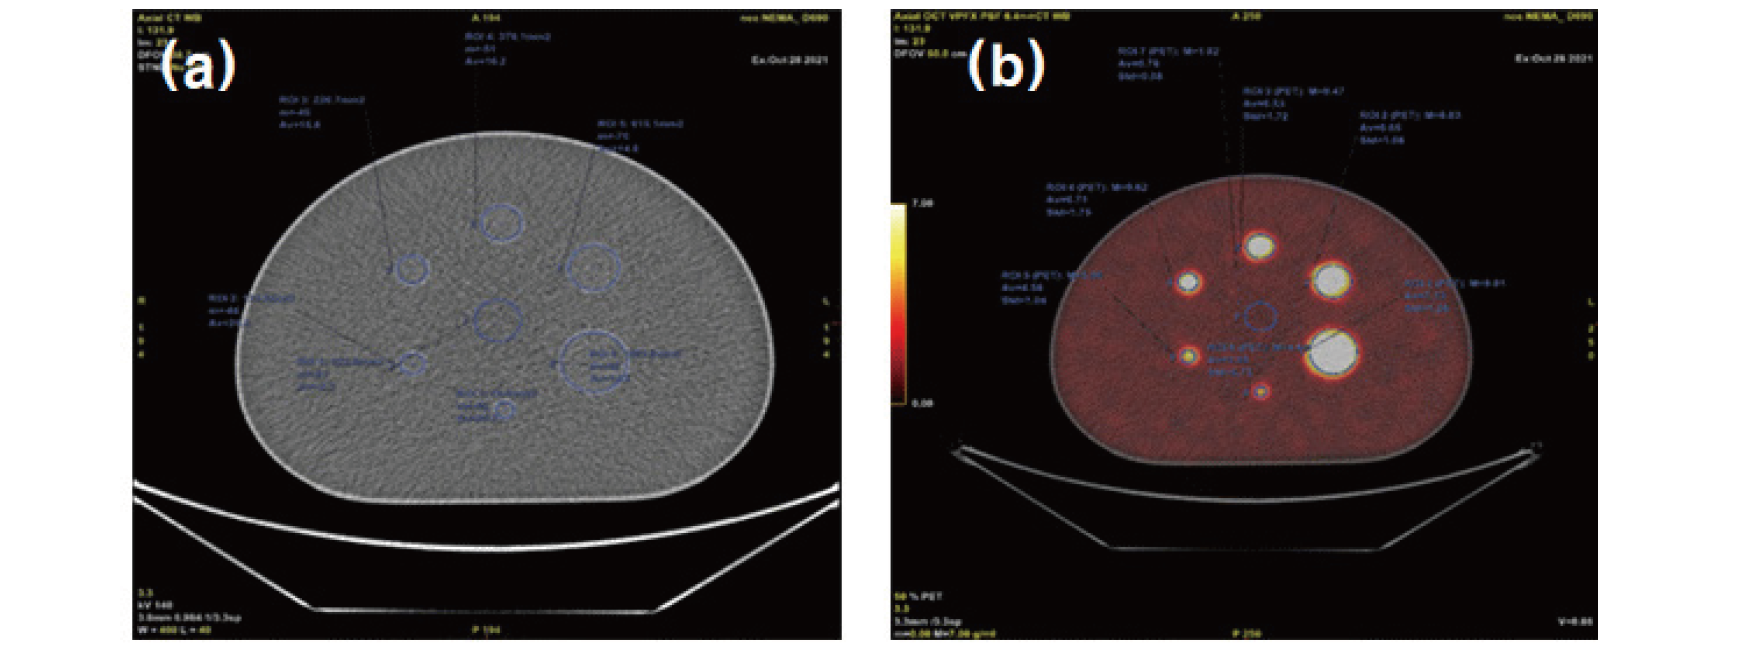
GE 사의 판독용 AW (Advantage Workstation) 4.7 소프트웨어 프로그램(General Electric Healthcare, USA)을 이용하여 PET 영상과 CT 영상을 융합한 후 CT 영상에서 6개 구의 크기에 맞게 ROI (Region of interest)를 설정하여 측정하였다(Fig. 5). 2021년 12월 3D Normalization, Well counter correction 수행 전후 phantom의 구와 TOF+PSF, TOF, OSEM (Ordered-subsets expectation maximization)+PSF, OSEM 및 각각 Gaussian filter (Full Width at Half Maximum, FWHM) 4.0 ㎜, 4.5 ㎜, 5.0 ㎜, 5.5 ㎜, 6.0 ㎜, 6.5 ㎜ 등 조건을 달리하여 각각 영상을 재구성한 후 비교분석 하였다. R ver.4.2.0 (The R Foundation) 통계분석 프로그램을 이용하여 재구성 방법, 정도 관리 수행 전후 대응표본 Wilcoxon test 분석을 하였으며 P<.05는 통계적으로 유의한 차이를 나타낸다.

http://dam.zipot.com:8080/sites/KJNMT/images/KJNMT-23-004_image/Figure_kjnmt_27_01_04_F5.png

Fig. 5. After fusing the PET and CT images using the AW program for reading by GE (GEAW 4.7), the ROI was set in the fusion image (b) and measured according to the size of six spheres in the CT image (a).

결과

1. 재구성 방법에 따른 회복계수

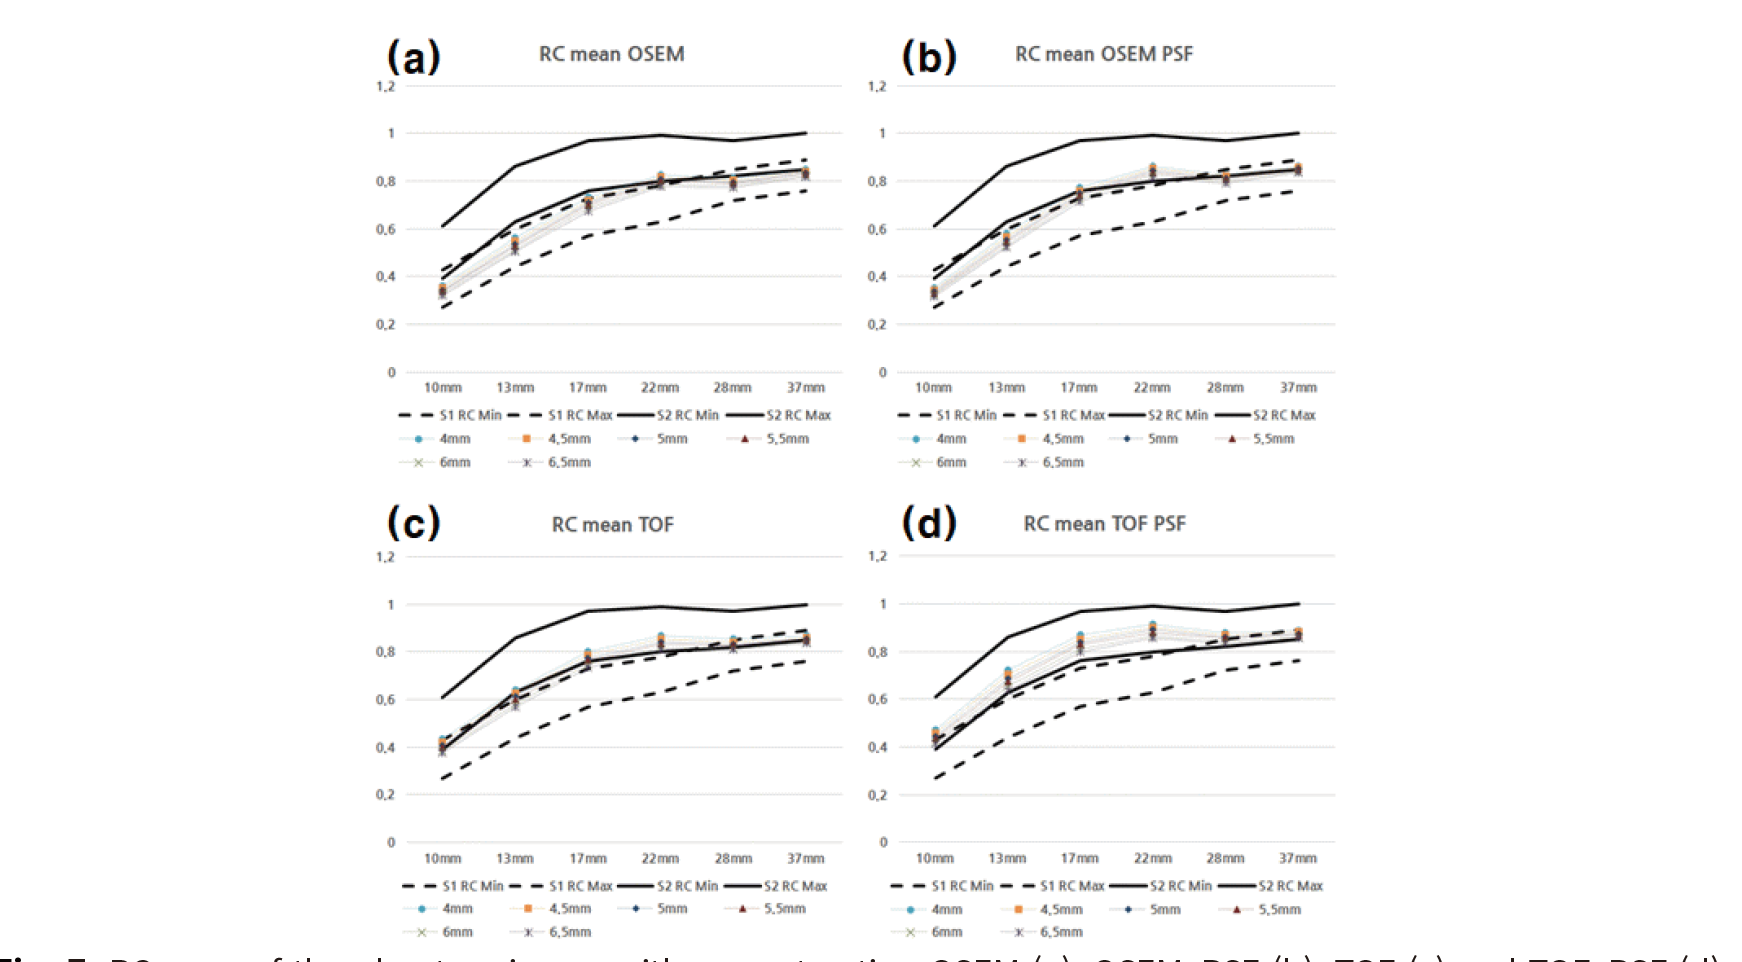
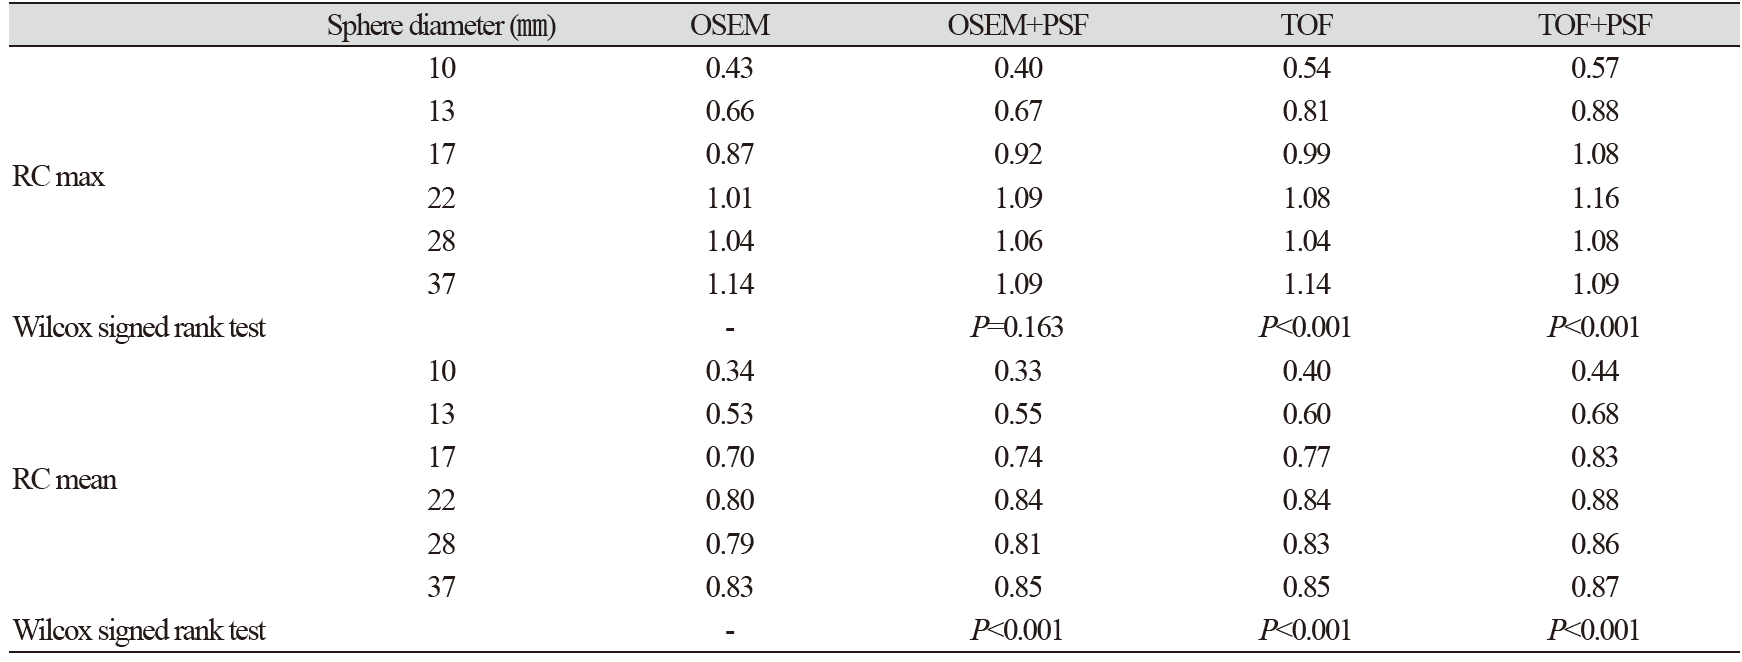
동일한 구의 diameter 값에서 재구성에 따른 phantom 영상의 회복계수는 전반적으로 증가하였다. RC 최대값은 OSEM을 기준으로 OSEM+PSF 0.01 (1.4%), TOF 0.07 (8.8%), TOF+PSF 0.12 (14%) 증가하였고 RC 평균값은 OSEM을 기준으로 OSEM+PSF 0.02 (3.1%), TOF 0.05 (7.3%), TOF+PSF 0.09 (14.1%) 증가하였다(Fig. 6, 7). 재구성 방법이 향상됨에 따라 회복계수가 증가하여 EARL 18F 인증사양인 standards 1에서 standards 2에 적합하게 변화하는 것을 확인하였다. 대응표본 Wilcox test 결과 대부분 P value는 0.001보다 작아 통계적으로 의미 있는 차이를 확인하였으며 변화치가 적은 OSEM+PSF의 RC 최대값은 의미 있는 차이를 보이지 않았다(Table 3).
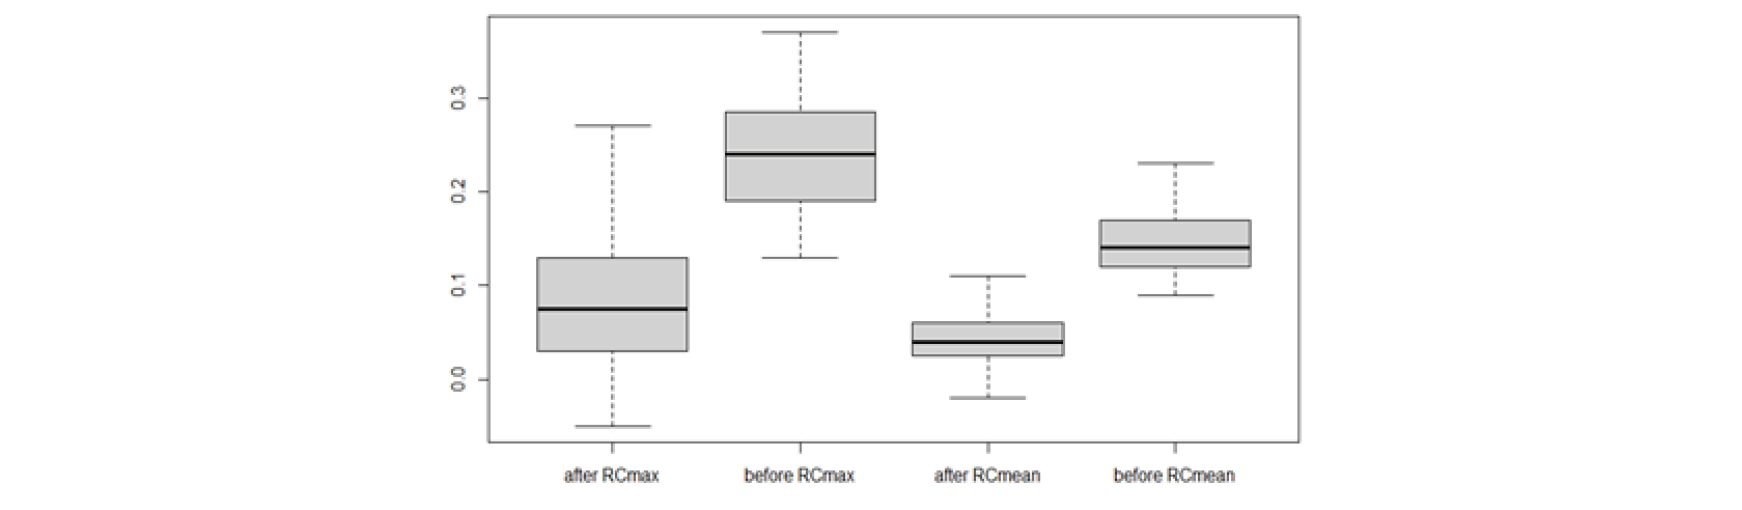
http://dam.zipot.com:8080/sites/KJNMT/images/KJNMT-23-004_image/Figure_kjnmt_27_01_04_F7.png

Fig. 6. RCmax of the phantom image with reconstruction OSEM (a), OSEM+PSF (b), TOF (c) and TOF+PSF (d) generally increased at the same diameter value of the sphere.

http://dam.zipot.com:8080/sites/KJNMT/images/KJNMT-23-004_image/Figure_kjnmt_27_01_04_F7.png

Fig. 7. RCmean of the phantom image with reconstruction OSEM (a), OSEM+PSF (b), TOF (c) and TOF+PSF (d) generally increased at the same diameter value of the sphere.

Table 3. RC according to reconstruction

http://dam.zipot.com:8080/sites/KJNMT/images/KJNMT-23-004_image/Table_kjnmt_27_01_04_T3.png

2. 분기정도관리에 따른 회복계수

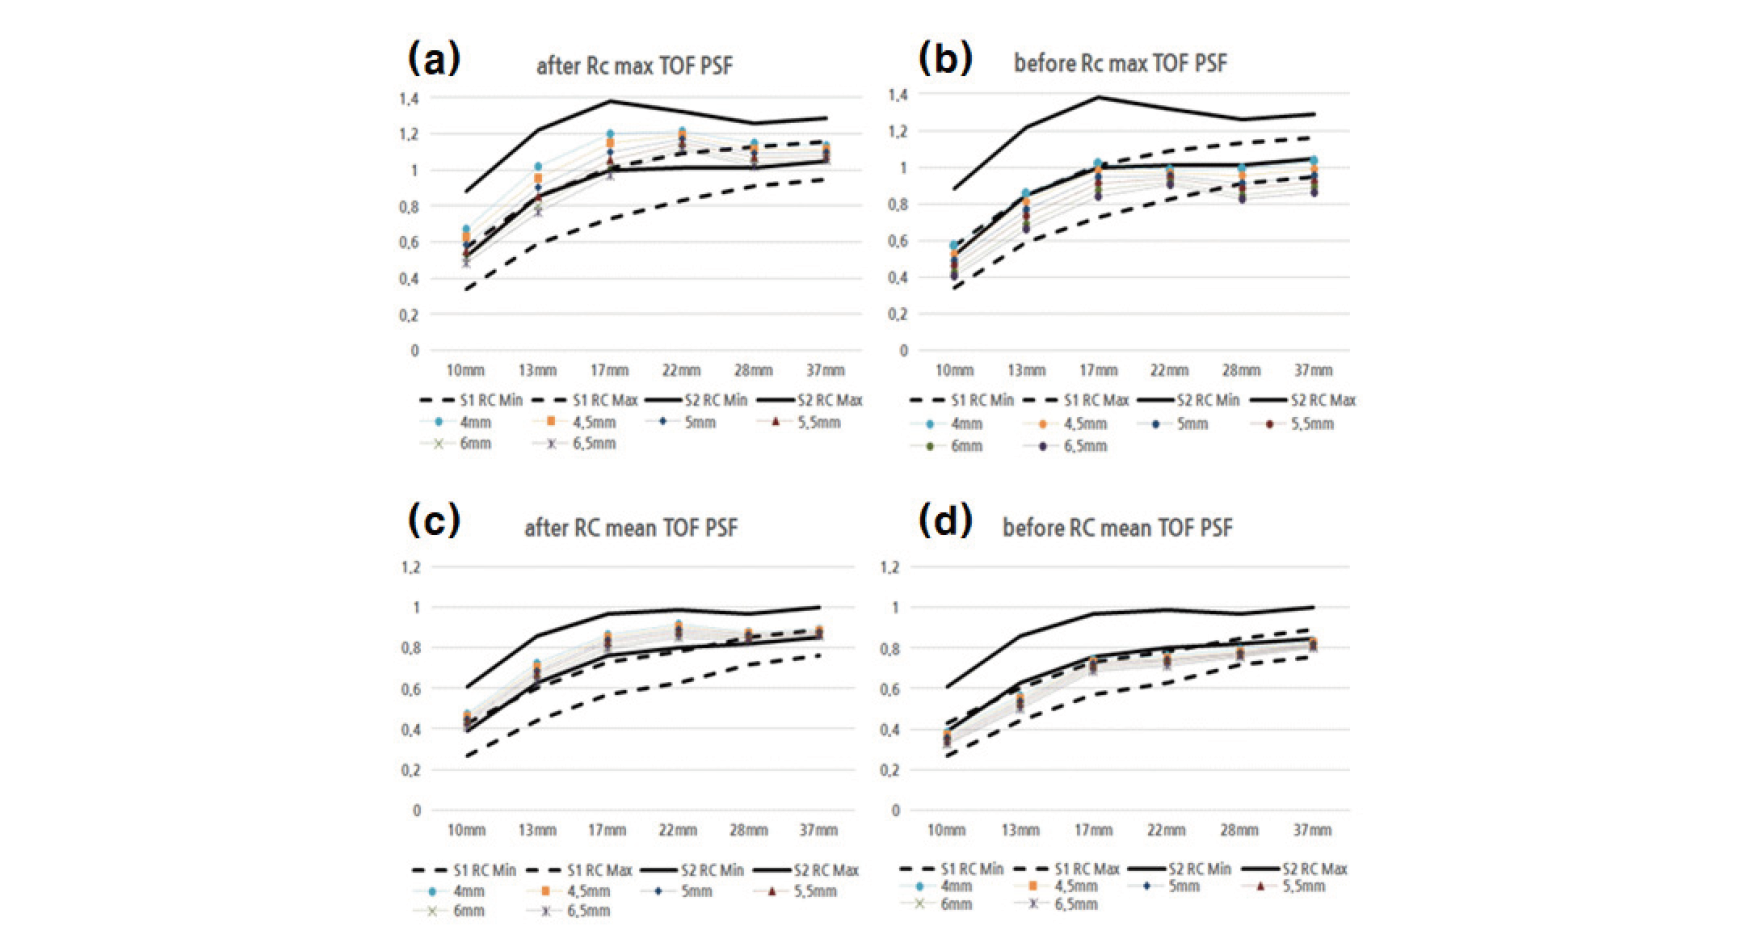
동일한 구의 diameter 값에서 분기정도관리 수행에 따른 phantom 영상의 회복계수는 전반적으로 증가하였다. EARL 18F 인증사양과 회복계수에 대한 box plot 결과 이상치는 발견되지 않았으며 RC 최대값은 수행 전에 비해 OSEM 평균 0.13 (17.6%), OSEM+PSF 0.11 (15.0%), TOF 0.16 (21.8%), TOF+PSF 0.15 (18.4%) 증가하였고 RC 평균값은 수행 전에 비해 OSEM 평균 0.09 (11.3%), OSEM+PSF 0.09 (11.3%), TOF 0.10 (12.5%), TOF+PSF 0.10 (12.8%) 증가하였다(Fig. 8, 9). 마찬가지로 분기정도관리 수행 후 회복계수가 증가하여 EARL 18F 인증사양인 standards 1에서 standards 2에 적합하게 변화하는 것을 확인하였다. 대응표본 Wilcox test 결과 모든 값에서 P value는 0.001보다 작아 통계적으로 의미 있는 차이를 보였다(Table 4).

http://dam.zipot.com:8080/sites/KJNMT/images/KJNMT-23-004_image/Figure_kjnmt_27_01_04_F8.png

Fig. 8. No outliers were identified in boxplot of EARL 18F accreditation and RCs.

http://dam.zipot.com:8080/sites/KJNMT/images/KJNMT-23-004_image/Figure_kjnmt_27_01_04_F9.png

Fig. 9. Both RCmax and RCmean increased (a, c) compared to before quality control (b, d) at the same sphere diameter value.

Table 4. RC according to quality control

http://dam.zipot.com:8080/sites/KJNMT/images/KJNMT-23-004_image/Table_kjnmt_27_01_04_T4.png

고찰

3D Normalization, Well counter correction 후 phantom 영상에서의 회복계수 값이 전반적으로 상승하였다. 정도관리는 품질관리를 보증하는 하나의 방편이고 진료의 질을 향상 시키고 환자의 안전을 도모하는데 필수적인 것이며 정기점검의 표준화된 주기와 절차를 따르는 것이 필요하다[15]. GE Discovery 600대 이하의 장비들은 기본적으로 68Ge pin source만 제공되어 18F flood phantom을 통하여 통합적인 분기정도관리를 해야 하지만 최신 GE Discovery MI 장비들은 제공되는 68Ge cylinder (Annular) phantom을 이용하여 3D Normalization, Well counter correction을 따로 정도관리가 가능하다[16]. 또한 제조사에서는 현재 여러 기관에서 사용되는 Discovery 700대 장비를 시작으로 3D Normalization, Well counter correction가 각각 점검주기를 경과 하면 상태 알림창으로 알리는 소프트웨어 업데이트 패치와 관리에 대한 노력을 높이고 있으며 병원 차원에서도 자체 정도관리 양식이나 학회 정도관리 사이트를 이용하여 계속적인 관심을 기울이고 있다. EARL 18F standard 2는 VOI (Volume of Interest) 기준으로 권고하고 있으나 GE Discovery 690 인스톨 당시 ROI 기준으로 최적화된 분석프로그램을 사용하여 kBq/㎖을 도출하였고 그에 맞는 장비관리를 하였다[17]. 이에 대하여 본 연구에서도 최적화된 값을 얻고자 설치 당시의 권고사항에 맞춰 연구를 진행하였다. 또한 제조사 3D Normalization, Well counter correction 권고 점검주기가 3개월이지만 연구 당시 제조사와 본원에서의 사정으로 인하여 3년 이상 수행되지 못하였다. 이에 따라 제조사에서도 연구 결과 값에 영향을 주었으리라 조언을 하였고 점검주기에 맞는 적절한 관리를 하는 장비에서는 일반화 될 수 없다고 생각된다. 본 연구를 통하여 PET-CT 시스템에서 정도 관리의 중요성에 대해서 다시 한 번 생각 할 수 있는 좋은 기회가 되었으면 좋겠다.

결론

본 연구에서는 PET-CT 3D Normalization, Well counter correction을 수행하기 전후 동일한 NEMA IEC body phantom 실험을 통하여 팬텀영상을 비교하고 정도관리의 유용성에 대하여 평가하고자 하였다. 3D Normalization, Well counter correction 후 phantom 영상에서의 회복계수 값이 전반적으로 상승하였다. 정도관리는 품질관리를 보증하는 하나의 방편이고 진료의 질을 향상 시키고 환자의 안전을 도모하는데 필수적인 것이며 정기점검의 표준화된 주기와 절차를 따르는 것이 필요하다.

References

1 1. Lee MC. Current status and future perspective of PET. Nucl Med Mol Imaging. 2002;36(1):1-7. 

2 2. Ko CS. Nuclear Medicine. 3rd ed. Korea med publish; 2008. p. 81, p. 106 

3 3. AAPM publication. AAPM report no.126. PET-CT acceptance testing and quality assurance. 2019 

4 4. General Electric Healthcare. Technical publication: Discovery™ PET-CT 600 series user manual 5400906-1KO. Milwaukee, General Electric company. 2019 

5 5. Korea Society of Nuclear Medicine Technologist. Guidelines for PET and PET-CT quality control items and measurement methods. 2009 

6 6. National Electrical Manufacturers Association NEMA standard publication NU 2-1994. Performance measurements of positron emission tomography. National Electrical Manufacturers Association. 1994 

7 7. National Electrical Manufacturers Association NEMA standard publication NU 2-2001. Performance measurements of positron emission tomography. National Electrical Manufacturers Association. 2001 

8 8. Lee BI. Quality assurance and performance evaluation of PET-CT. Nucl Med Mol Imaging. 2008;42(2):137-44. 

9 9. Bettinardi V, Presotto L, Rapisarda E, Picchio M, Gianolli L, Gilardi MC. Physical performance of the new hybrid PET-CT Discovery-690. Med Phys. 2011;38(10):394-411. 

10 10. Boellaard R, O’Doherty MJ, Weber WA, Mottaghy FM, Lonsdale MN, Stroobants SG, et al. FDG PET and PET-CT: EANM procedure guidelines for tumor PET imaging: version 1.0. Eur J Nucl Med. 2010;37:181. 

11 11. National Electrical Manufactures Association. Standards publication NU-2: Performance measurements of positron emission tomographys. Rosslynm VA. 2007 

12 12. International Eletrotechnical Comission. Characteristics and test conditions Part1: Positron emission tomographys. Genevam Switzerland. 1998 

13 13. Kaalep A, Burggraaff CN, Pieplenbosch S, Verwer EE, Sera T, Zijlstra J, et al. Quantitative implications of the updated EARL 2019 PET-CT performance standards. EJNMMI Physics. 2019;6:28. 

14 14. EARL PET-CT accreditation user manual Version 3.3. 2021 

15 15. Sokole EB, Plachcinska A, Britten A, Georgosopoulou ML, Tindale W, Klett R. Routine quality control recommendations for nuclear medicine instrumentation. EJNMMI. 2010;37:662-71. 

16 16. General Electric Healthcare. Technical publication: Discovery™ MI and Discovery™ MI columbia user manual 5720964-1EN. Milwaukee, General Electric Company. 2019 

17 17. Kaalep A, Sera T, Bijndorp S, Yaqub M, Talsma A, Lodge MA, et al. Feasibility of state of the art PET-CT systems performance harmonisation. EJNMMI. 2018;45:1344-61.